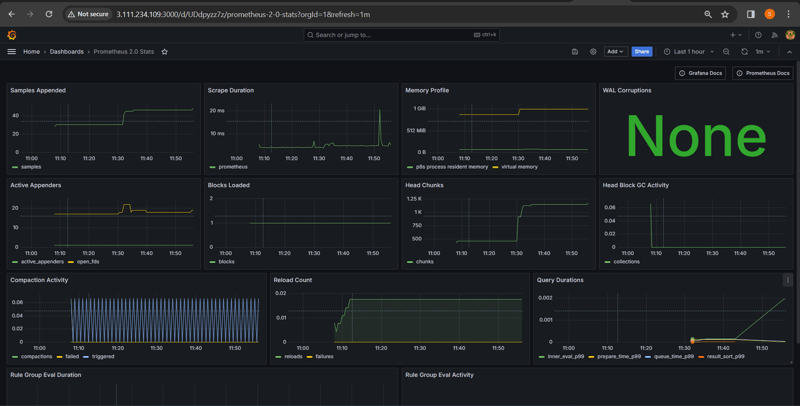
What is Prometheus ?
Prometheus is a open source Linux Server Monitoring tool mainly used for metrics monitoring, event monitoring, alert management, etc.
Prometheus has changed the way of monitoring systems and that is why it has become the Top-Level project of Cloud Native Computing Foundation (CNCF).
Prometheus uses a powerful query language i.e. “PromQL”.
In Prometheus tabs are on and handles hundreds of services and microservices.
Prometheus use multiple modes used for graphing and dashboarding support.
Prometheus Components
- Prometheus Server Prometheus server is a first component of Prometheus architecture. Prometheus server is a core of Prometheus architecture which is divided into several parts like Storage, PromQL, HTTP server, etc. In Prometheus server data is scraped from the target nodes and then stored int the database. 1.a. Storage Storage in Prometheus server has a local on disk storge. Prometheus has many interfaces that allow integrating with remote storage systems. 1.b. PromQL
Prometheus uses its own query language i.e. PromQL which is very powerful querying language.
PromQL allows the user to select and aggregate the data.
Service Discovery Next and very important component of Prometheus Server is the Service Discovery. With the help of Service discovery the services are identified which are need to scraped. To Pull metrics, identification of services and finding the targets are compulsory needed. Through Service discovery we monitor the entities and can also locate its targets.
Scrape Target Once the services are identified and the targets are ready then we can pull metrics from it and can scrape the target. We can export the data of end point using node exporters. Once the metrics or other data is pulled, Prometheus stores it in a local storage.
Alert Manager Alert Manager handles the alerts which may occurs during the session. Alert manager handles all the alerts which are sent by Prometheus server. Alert manager is one of the very useful component of Prometheus tool. If in case any big error or any issue occurs, alert manager manage those alerts and contact with human via E-mail, Text Messages, On-call, or any other chat application service.
User Interface User interface is also a important component as it builds a bridge between the user and the system. In Prometheus, user interface are note that much user friendly and can be used till graph queries. For good exclusive dashboards Prometheus works together with Grafana (visualization tool). Using Grafana over Prometheus to visualize properly we can use custom dashboards. Grafana dashboards displays via pie charts, line charts, tables, good data graphs of CPU usage, RAM utilization, network load, etc with indicators. Grafana supports and run with Prometheus by querying language i.e. PromQL. To fetch data from Prometheus and to display the results on Grafana dashboards PromQL is used. What is Grafana ? Grafana is a free and open source visualization tool mostly used with Prometheus to which monitor metrics. Grafana provides various dashboards, charts, graphs, alerts for the particular data source. Grafana allows us to query, visualize, explore metrics and set alerts for the data source which can be a system, server, nodes, cluster, etc. We can also create our own dynamic dashboard for visualization and monitoring. We can save the dashboard and can even share with our team members which is one of the main advantage of Grafana. What is Node Exporter ? Node exporter is one of the Prometheus exporters which is used to expose servers or system OS metrics. With the help of Node exporter we can expose various resources of the system like RAM, CPU utilization, Memory Utilization, disk space. Node exporter runs as a system service which gathers the metrics of your system and that gathered metrics is displayed with the help of Grafana visualization tool. Prerequisites Ubuntu with 22.04 Version Root user account with sudo privilege. Prometheus system user and group. Sufficient storage on your system and good internet connectivity. Ports Required- 9090 (Prometheus), 3000 (Grafana), 9100 (Node Exporter) We will update the system repository index by using the following command.
Step #1:Creating Prometheus System Users and Directory
Create a system user for Prometheus
sudo useradd --no-create-home --shell /bin/false prometheus
Output
Create the directories in which we will be storing our configuration files and libraries:
sudo mkdir /etc/prometheus
sudo mkdir /var/lib/prometheus
Output
Set the ownership of the /var/lib/prometheus directory
sudo chown prometheus:prometheus /var/lib/prometheus
Output
Step #2:Download Prometheus Binary File
Now we will download the latest version of Prometheus. We can copy the download link as per our Operating System from Prometheus download page
Using below command we can download Prometheus, here we are downloading Prometheus 2.46 version, you use above link to download specific version.
You need to inside /tmp :
cd /tmp/
Download the Prometheus setup using wget
wget https://github.com/prometheus/prometheus/releases/download/v2.46.0/prometheus-2.46.0.linux-amd64.tar.gz
Output
Extract the files using tar
tar -xvf prometheus-2.46.0.linux-amd64.tar.gz
Move the configuration file and set the owner to the prometheus user
cd prometheus-2.46.0.linux-amd64

sudo mv console* /etc/prometheus

sudo mv prometheus.yml /etc/prometheus

sudo chown -R prometheus:prometheus /etc/prometheus
Output
Move the binaries and set the owner
sudo mv prometheus /usr/local/bin/

sudo chown prometheus:prometheus /usr/local/bin/prometheus
Output
Step #3:Prometheus configuration file
We have already copied /opt/prometheus-2.26.0.linux-amd64/prometheus.yml file /etc/prometheus directory, verify if it present and should look like below and modify it as per your requirement.
sudo nano /etc/prometheus/prometheus.yml
Step #4:Creating Prometheus Systemd file
Create the service file
[Unit]

Description=Prometheus

Wants=network-online.target

After=network-online.target

[Service]

User=prometheus

Group=prometheus

Type=simple

ExecStart=/usr/local/bin/prometheus \

— config.file /etc/prometheus/prometheus.yml \

— storage.tsdb.path /var/lib/prometheus/ \

— web.console.templates=/etc/prometheus/consoles \

— web.console.libraries=/etc/prometheus/console_libraries

[Install]

WantedBy=multi-user.target
Output
Reload systemd
sudo systemctl daemon-reload
Start, Enable, Status Prometheus service
sudo systemctl start prometheus

sudo systemctl enable prometheus

sudo systemctl status prometheus
Launch the Prometheus server by executing the following command:
./prometheus –config.file=prometheus.yml (or) ./prometheus
Verify Prometheus Installation:
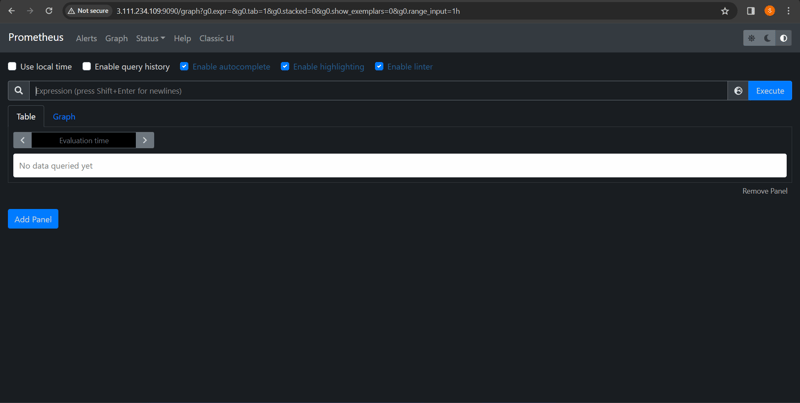
Open your web browser and access http://server-ip-address:9090. If Prometheus is running correctly, you will see the Prometheus web interface.
Steps to Install and set up the Grafana on Ubuntu 20.04 and 22.04/EC2
Grafana
What is Grafana?
Grafana is an open-source platform for data visualization, monitoring, and analysis. It allows you to create and display interactive, customizable dashboards with real-time monitoring and analytics capabilities. Grafana supports a wide range of data sources, including time-series databases and relational databases.
With Grafana, you can easily create visualizations and alerts based on your data, as well as collaborate with other team members through sharing and annotations. It also provides advanced features like plugins, annotations, and panels, which allow you to extend the platform’s capabilities and create custom visualizations and integrations.
Grafana is widely used in industries such as IT, finance, healthcare, and more, for monitoring and analyzing various metrics, logs, and sensor data. It is known for its user-friendly interface, ease of use, and powerful features, making it a popular choice for data visualization and monitoring.
Installation of Grafana
Update your Ubuntu system using the following command:
sudo apt-get update
Getting packages on Ubuntu distributions
Add the Grafana repository to your Ubuntu installation:
sudo apt-get install -y apt-transport-https
sudo apt-get install -y software-properties-common wget
sudo wget -q -O /usr/share/keyrings/grafana.key https://apt.grafana.com/gpg.key
echo "deb [signed-by=/usr/share/keyrings/grafana.key] https://apt.grafana.com stable main" | sudo tee -a /etc/apt/sources.list.d/grafana.list
Install Grafana as a service
Now that all the packages are available, it is time for you to install them.
Update your package list using the following command:
sudo apt-get update
Install the Grafana package using the following command:
sudo apt-get install grafana
Check Grafana version
You can use the Grafana version command to check the currently installed version.
grafana-server -v
Start the Grafana service using the following command:
sudo systemctl start grafana-server
Enable the Grafana service to start on boot:
To start it and make sure that the service is always available every time the machine is restarted, type the command:
sudo systemctl enable grafana-server
Verify your Grafana installation
Check the status of the Grafana service to make sure it is running.
To verify it, run the following command:
sudo systemctl status grafana-server
Grafana should run automatically, but if this is not the case, make sure to start it.
sudo service grafana-server start
In the future to stop and restart the Grafana, the commands are:
Restart
sudo service grafana-server restart
Stop
sudo service grafana-server stop
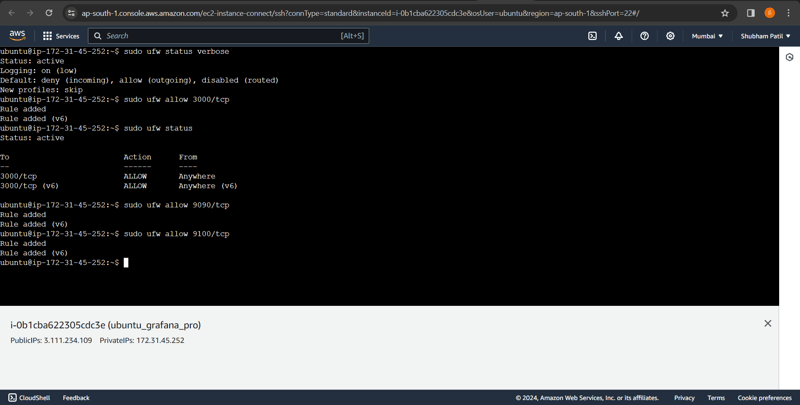
Allow Grafana TCP port 3000 in the Firewall
Grafana's default HTTP port is 3000, you’ll need to allow access to this port on the firewall.
If your firewall is UFW type the following commands:
sudo ufw allow 3000/tcp
That’s it! You have now installed Grafana on Ubuntu. You can now start using it to create dashboards and visualize your data.
Set up Grafana
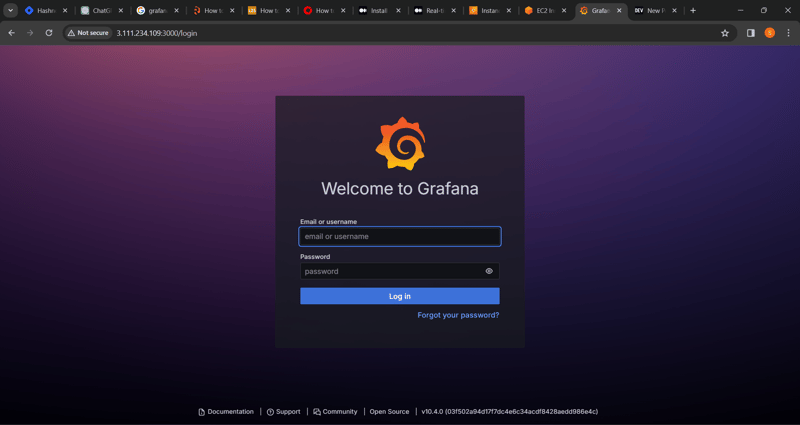
- Access the Grafana web UI by visiting http://localhost:3000 in your web browser.
Login to Grafana web UI
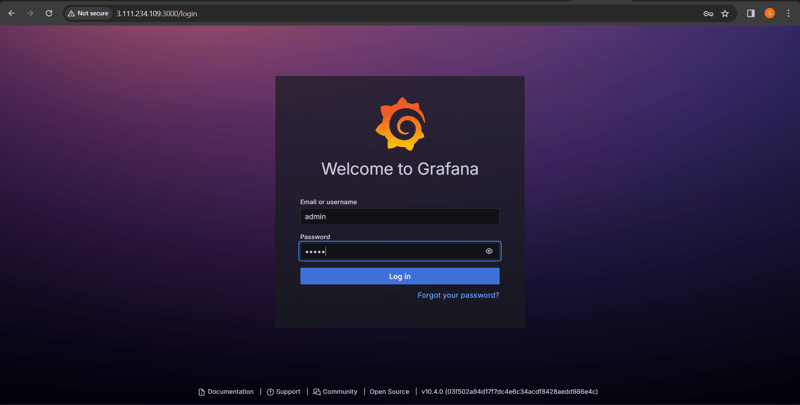
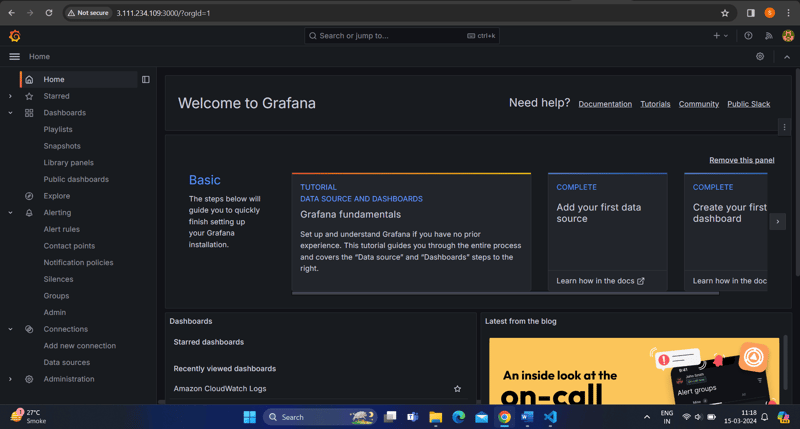
Dashboard Grafana
Node Exporter:-- is a vital component in the Prometheus ecosystem, serving as an agent for collecting various system metrics from Linux, Windows, macOS, and other Unix-like systems. Its primary use is to expose system-level metrics in a format that Prometheus can scrape, enabling comprehensive monitoring and alerting capabilities for infrastructure and applications.
Here are some common use cases and benefits of Node Exporter:
System Monitoring: Node Exporter collects a wide range of system metrics, including CPU usage, memory utilization, disk I/O statistics, network activity, filesystem metrics, and more. This allows you to monitor the health and performance of individual nodes in your infrastructure.
Resource Utilization Analysis: By collecting metrics on CPU, memory, disk, and network usage, Node Exporter enables you to analyze resource utilization patterns over time. This information helps identify performance bottlenecks, optimize resource allocation, and ensure efficient use of system resources.
Capacity Planning: With Node Exporter, you can track trends in resource utilization and predict future capacity requirements. By monitoring metrics such as CPU load, memory usage, and disk space, you can proactively allocate resources to meet the demands of your applications and users.
Troubleshooting and Debugging: Node Exporter provides valuable insights into system behavior and performance, making it an indispensable tool for troubleshooting and debugging issues. Whether you're diagnosing performance bottlenecks, investigating system crashes, or analyzing network activity, Node Exporter's metrics offer valuable context for identifying and resolving problems.
Integration with Prometheus and Grafana: Node Exporter integrates seamlessly with Prometheus, allowing you to scrape system metrics and store them in Prometheus's time-series database. You can then visualize these metrics in Grafana, creating custom dashboards to monitor system health, track performance trends, and set up alerts for abnormal behavior.
Custom Metric Collection: In addition to built-in system metrics, Node Exporter supports the collection of custom metrics through textfile and SNMP exporters. This flexibility enables you to monitor application-specific metrics and extend Node Exporter's functionality to suit your monitoring requirements.
# Install Node Exporter
sudo useradd --no-create-home --shell /bin/false node_exporter
wget https://github.com/prometheus/node_exporter/releases/download/v1.2.2/node_exporter-1.2.2.linux-amd64.tar.gz
tar -xzf node_exporter-1.2.2.linux-amd64.tar.gz
sudo mv node_exporter-1.2.2.linux-amd64/node_exporter /usr/local/bin/
sudo chown node_exporter:node_exporter /usr/local/bin/node_exporter

# Create Node Exporter service
cat << EOF | sudo tee /etc/systemd/system/node_exporter.service
[Unit]
Description=Node Exporter
After=network.target

[Service]
User=node_exporter
ExecStart=/usr/local/bin/node_exporter

[Install]
WantedBy=default.target
EOF

# Reload systemd and start Node Exporter service
sudo systemctl daemon-reload
sudo systemctl start node_exporter
sudo systemctl enable node_exporter
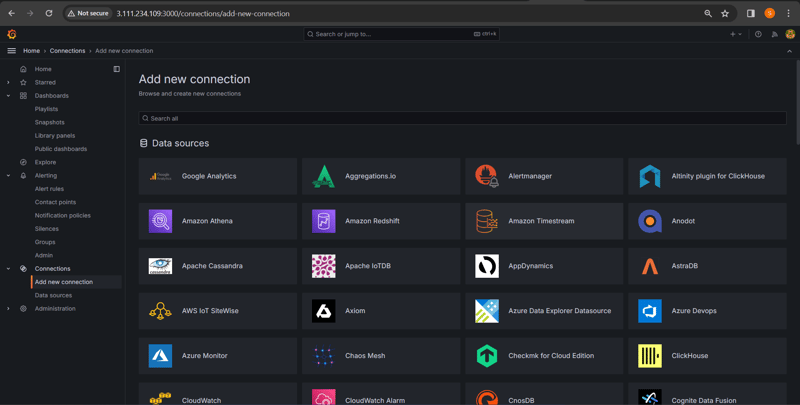
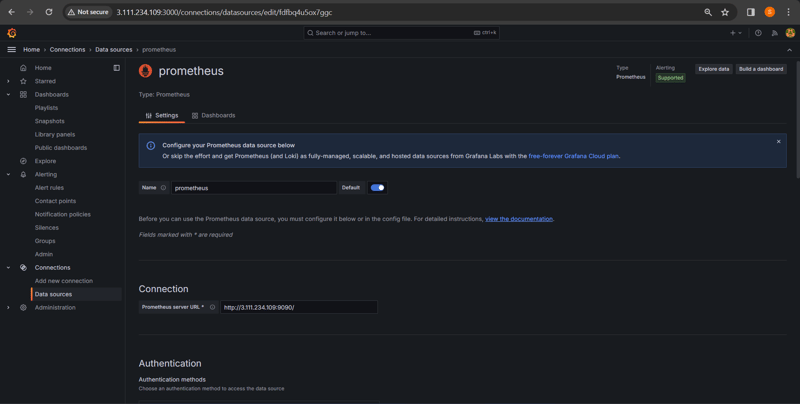
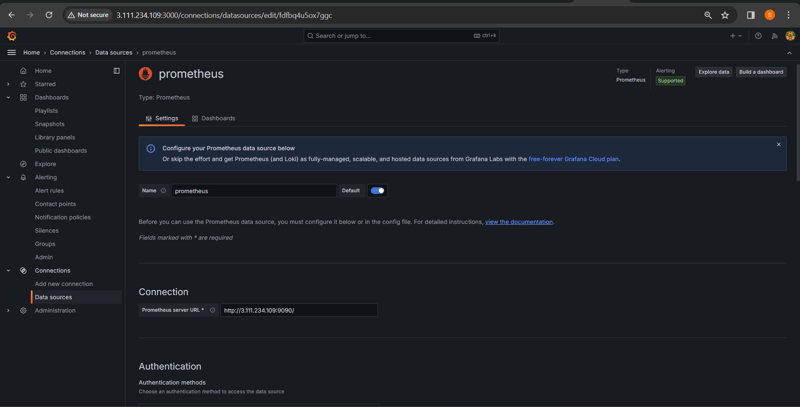
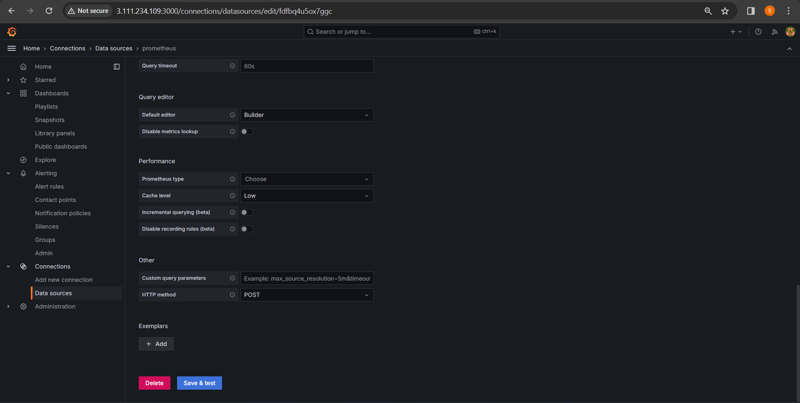
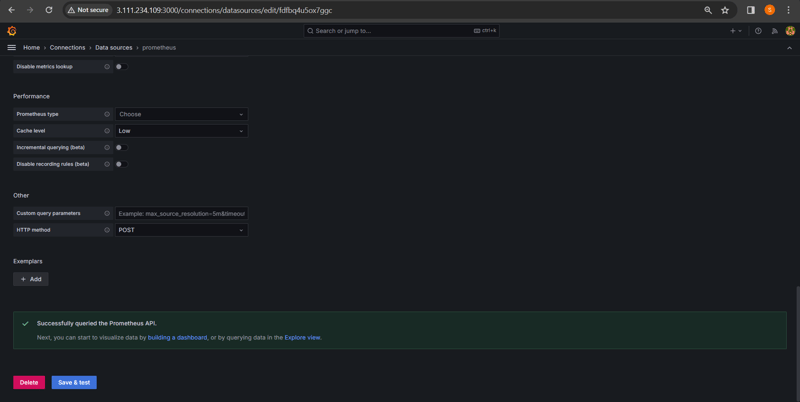
Setup for Data Source
After Setup Final Dashboard Output:=
Same as for Aws EC2 & EBS

EBS Monitoring


EC2 Monitoring


or Directly just Trigger setup.sh file it will do all setup at once
#!/bin/bash

# Update package repositories
sudo apt-get update -y

# Install required dependencies
sudo apt-get install -y wget

# Install Prometheus
sudo wget https://github.com/prometheus/prometheus/releases/download/v2.33.1/prometheus-2.33.1.linux-amd64.tar.gz
sudo tar -xzf prometheus-2.33.1.linux-amd64.tar.gz
sudo mv prometheus-2.33.1.linux-amd64 /opt/prometheus

# Create Prometheus service
cat << EOF | sudo tee /etc/systemd/system/prometheus.service
[Unit]
Description=Prometheus Server
Wants=network-online.target
After=network-online.target

[Service]
Type=simple
ExecStart=/opt/prometheus/prometheus --config.file=/opt/prometheus/prometheus.yml --storage.tsdb.path=/opt/prometheus/data
Restart=always

[Install]
WantedBy=multi-user.target
EOF

# Reload systemd and start Prometheus service
sudo systemctl daemon-reload
sudo systemctl start prometheus
sudo systemctl enable prometheus

# Install Grafana
sudo apt-get install -y apt-transport-https software-properties-common wget
sudo mkdir -p /etc/apt/keyrings/
wget -q -O - https://apt.grafana.com/gpg.key | gpg --dearmor | sudo tee /etc/apt/keyrings/grafana.gpg > /dev/null
echo "deb [signed-by=/etc/apt/keyrings/grafana.gpg] https://apt.grafana.com stable main" | sudo tee -a /etc/apt/sources.list.d/grafana.list

# Updates the list of available packages
sudo apt-get update

# Installs the latest OSS release:
sudo apt-get install  -y grafana


# Start Grafana service
sudo systemctl start grafana-server
sudo systemctl enable grafana-server

# Install Node Exporter
sudo useradd --no-create-home --shell /bin/false node_exporter
wget https://github.com/prometheus/node_exporter/releases/download/v1.2.2/node_exporter-1.2.2.linux-amd64.tar.gz
tar -xzf node_exporter-1.2.2.linux-amd64.tar.gz
sudo mv node_exporter-1.2.2.linux-amd64/node_exporter /usr/local/bin/
sudo chown node_exporter:node_exporter /usr/local/bin/node_exporter

# Create Node Exporter service
cat << EOF | sudo tee /etc/systemd/system/node_exporter.service
[Unit]
Description=Node Exporter
After=network.target

[Service]
User=node_exporter
ExecStart=/usr/local/bin/node_exporter

[Install]
WantedBy=default.target
EOF

# Reload systemd and start Node Exporter service
sudo systemctl daemon-reload
sudo systemctl start node_exporter
sudo systemctl enable node_exporter

